I decided the only way to properly look at the environments at home would be to recreate them in 3D. plus it also gives me an idea of areas we can project on.
this is the area behind C103, using grungy lighting to give an idea of what it would be at night.
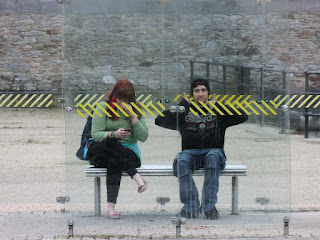
Here is the bus stop at Cremyll street, using parcially transparent planes i created the glass panels. a glass environment created for the shelter of its inhabitants.
Wednesday, 16 December 2009
Wednesday, 9 December 2009
6- Workspaces 2 Further Study of Location
Looking at my images of the bus stop at Cremyll street, i saw that the diagonal bars on the bus stop, which i later over layered in white in my projection simulation images, seemed to censor out parts of the people who were sat at there. this go me thinking into how this would look with black censor bars and how censor ship is used.
Then Looking at my second site, the back of C103 i wanted to brighten the place up, so i found a mural on google search and covered the walls of C103 in it. i think if it was tidier it would look a lot better.

My next attempt to improve the appearance of C103 was to come up with a video gradually taking away the parts which make it look so run down. Trying to make it look a little bit more inviting. its still looking a bit dull and grey but its an improvement.

Then Looking at my second site, the back of C103 i wanted to brighten the place up, so i found a mural on google search and covered the walls of C103 in it. i think if it was tidier it would look a lot better.

Tuesday, 24 November 2009
5- Workspaces 2 Location Location Location
Choosing a location had to be dependant on the ability to project effictilvely within the area aswell as it being within Stonehouse itself.
The first location i was looking at was Cremyll street, which is towards the south of Stonehouse. I chose this area because they contain glass bus shelters, which i think would be a really interesting surface to project onto. They are also their own small environments, places where people go to excape the weither or sit while waiting for a bus. this relates the the origional dome idea, the idea of an environment, this is a more real and solid environment however even if the walls are glass and transparent, unlike the invisible or 100% transparent (physically nonexistant) walls.

The first location i was looking at was Cremyll street, which is towards the south of Stonehouse. I chose this area because they contain glass bus shelters, which i think would be a really interesting surface to project onto. They are also their own small environments, places where people go to excape the weither or sit while waiting for a bus. this relates the the origional dome idea, the idea of an environment, this is a more real and solid environment however even if the walls are glass and transparent, unlike the invisible or 100% transparent (physically nonexistant) walls.
The progection i would havto project on would have to be just as understandable when viewed in reverse because i would like the projection to also work like a tv screen to the people in the bus shelter. There is an issue with this however if i project head on , then people in the seats wouldnt be able to see much as the light from the projector would shine in their eyes. also the nature of the transparent surface would meen some of the image would transfer through to the back of the bus shelter.
Here is an example image which im going to use to show how i think the projection would work. usint contrasting geometric shapes and colours to make it show up.

Here is my visualisation of the projection on the chosen surface and how people would look when sitting within the shelter. I have darkened the origional image to simulate night, which would be the conditions in which we would have to project in order for the projections to show up.

The second and more visually solid place i have looked at for a projection site is at the back of C103 a popular club in the heart of Union Street. The site is visible from the smoking area of the club and at night is buzzing with activity so we wouldnt have a problem with finding people to see it. 
Below: is a panoramic image of the are behind C103, showing great potential for projecting video. its a very dirty and grimy area of stonehouse. Getting darker quicker then other areas because its surrounded by buildings not allowing a lot of light in.

www.oneforthedesigners.co.uk/c103area.jpg
for larger image
This image shows 3 possible positions for the projection to take place, my favourite being where the stairs are located. as this creates a challenge to use this 3D surface to its full potential. it is also in a man made alcove surrounded on 5 of its six sides making it sheltered aswell as dark. The curved walls on the other two sides make the other surfaceses uite interesting visually, plus they also have a different texture to the rest of the walls as they are bocked in windows. blocked in by rough breeze blocks creating a geometric textured surface in itself.

www.oneforthedesigners.co.uk/c103projected.jpg
for larger image
This is my graphical light study of the alleyway. for the best view click on the link for the image to be enlarged. the area i was planning on projecting was the section on the left where there is mainly black with a batch of white. this would be the best area as we would have less area for the light to be dispursed. the area on the right which is drker is the back of C103 where the smoking area is whis is facing the area where im hoping to project our groups final outcome. This image really brings out the grungy nature of the alleyway in a cortoon esque form, the dark corners and sections making it seem eerie yet mysterious. what could be lurking round the corner? it also shows how naked and bare the area is when people arent present, i think if i were to recreate this image on a wednesday night it would tell a completely different story.

www.oneforthedesigners.co.uk/c103cartoongrunge.jpg
for larger image
Tuesday, 10 November 2009
4- Workspaces 2 Wi-fi Environments
This was Toyota's marketing technique for the launch of the 3rd generation Prius Hybrid in 2010. They were first brought to Boston but have now moved to major cities across the USA. Working on the idea their new Prius offers virtually everything you need in a car, "advanced technology, extra power, space, safety and 50 miles per gallon – all while providing what nature craves most: fewer smog-forming emissions." with there theme “Harmony between Man, Nature and Machine.” So there campaign was to visualise and present this in an idea which the public could see and relate to. So they created these 18 foot high solar panel daisies with free wi-fi connectivity ,power and enough comfortable seating for 10 people. visualisation of nature, using environmentally friendly energy providing a free service which anyone can use. They not only brighten up the environment visually but give you the idea of clean technology. well...“Harmony between Man, Nature and Machine.”

In the design you can see that the solar panels have been placed behind the petals and around the upper stem making the most of the organic spanning of the flower. the leaves have been used to advertise there product and add to the message which they are trying to show. you can see the erganomic design of the seating area which is in a natural green. The power sockets are based around the edges of the seating area. These environmentally friendly communication ports are a truely creative way of getting a concept of a car accross to the public.

Sunday, 8 November 2009
3- Workspaces 2 Postcard
Here is my submission for the Stonehouse postcard. based on my previous ideas of the wi-fi biodomes i placed them in position where a row of terrace houses would be, this is how i imagine the domes to look as a visual space.


Saturday, 24 October 2009
2- Workspace 2 Ideas
We got the opportunity to walk round Stonehouse and study the area. While we were doing this one of our group members checked the wi-fi strengths in different areas. This gave us the idea of basing our project on wi-fi signals. Here are the wi-fi hotspots i found on google maps round the areas we were walking:

While looking at these i was thinking about how wi-fi signals would look if we could see them. Coming out of there base unit they would probably make a spherical or dome shape. The domes would increase and decrease in size as the signal changes much like a lungs when the air capacity changes. The image below shows how the dome would form and how the internet strength changes as you get further away from the heard of the signal.

This got me onto my next thought about our increasing need to be wi-fi connected. taking this point to the extreme i was thinking about what if we lived off wireless and had to be near wi-fi in order to survive(a wifi connected atmosphere) . Looking at historical maps of Stonehouse we found that Victoria park was once underwater, what if all of Stonehouse was under water?. This then expanded the idea that these domes could be the only place we can breath /live is in these domes/bubbles/pockets of life/bio domes. Then to enhance this idea i was thinking about mobile devices. would you leave the house without your mobile? could you survive without it? would you want to?. i am now seeing mobiles as portable domes, portable atmospheric bubbles or bio domes. much like the old diving helmets that were worn. so we now have communities made up of bubble atmosphere and people walking round only able to survive because they have these mobile pockets of communication. so using the map of wi-fi hotspots i created this:
Wi-fi Biomes
Here i have created a clip of wi-fi bio domes in positions where personal routers would be present. I chose this street because it has two rows of terrace houses and it is quite effective seeing these wi-fi communities together.
Existing real bio domes which have become communities of plants built as an ecosystem to allow certain plants to survive. The Eden project is such a place with its giant domes built out of hexagons and pentagons of tough plastic. Each dome creates different environments, tropical, warm and Mediterranean built to enable different plant life to survive.

Friday, 16 October 2009
1. Workspaces 2 - Transforming Stonehouse
In this project we were asked to look at the Stonehouse area of Plymouth. I thought the best way of looking at the are would be to find some online statistics. The first set if information I found was about the crime rate in Stonehouse and the comparison between 2008 and 2009.
The area in the red rectangle is Stonehouse, the area of my study. From this map we can see that Stonehouse has a much larger crime rate then the surrounding area. looking at stats i have found on the Devon and Cornwall police site i can see that Stonehouse has the largest crime rate in Devon and Cornwall.

Crime rates* in this area for the last 12 months:

*Crime rates is per 1000 people.
From these stats I can see crime rate has risen by 2 per every thousand people since October 2008 and the average number of crimes in this area has increased from 149.7 to 179 which is 19.6% compared to the same three months last year.
The following maps were taken from the Plymouth councils site.
This map shows the roads running through Stonehouse and their hierarchy. From the larger roads (A) which will run from town to town, these will hold the larger and faster flow of traffic. Then the B roads which go connect different parts of the town to the A roads. Followed by the secondary roads which route off connecting different parts of the town together. Then lastly the access roads which are the quieter roads which you will find houses and buisnesses off. These roads have the lower speed limits. The access roads are the most interesting to look at with there irregular gridded structure which looks like it was designed by someone using an Etch-a-sketch.

The image below looks at the footpaths, cyclepaths and parks within stonehouse. These are important because they give is an insight into the leasure aspects of Stonehouse as an area and the possible routes to and from work when not using a car. It is interesting to see the large band of open space at the top edge of stonehouse, this was once part of Stonehouse pool, you can see where the water has shaped the landscape just from this 2d map. It now makes up victoria park a popular area for sports and the local carboot.
 Below: This is a row of images i have created as my "before experience maps". Using information collected from maps i have come up with an earlier version "left-hand side" to current version "right-hand side" of a map of Stonehouse. with a combination of the two in the middle. Using a basic clour scheme i wanted to visually show how the landscape has changed in some areas via human construction and also how natural erosion has created a form of its own. The obviouse thing is the development of the town over the water. The way the general land mass has increased along with the built up areas (grey). Areas of parkland or open space (green) has decreased with the overtake of development and yet you can see how where the river once led, at the top left of the far left image, there is gassland and you can still see the form n which the rivver had once taken.


At the begining of this project i wanted to look at the geographical history of Stonehouse. Looking at the map below you can see a large body of water moving round the top of Stonehouse. where the water takes up is now where victoria park lies you can still see the edges of where the water once was and the shape created by the water eroding the banks ( red line ). You can also see where some structures are still present een though they may not have the same purpose yu can see the shapes they have imprinted on the landscape (gren line). Some major streets are still present (yellow line) one example is union street. You can see on both maps that some land has been claimed from the water where docks have expanded over where the water is present in the older map (blue line). Obviously the accuracy of the older map is questionable as there map making methods were not as advanced as ours, plus i have the satalite imagery for the present day image is spot on.

http://img251.imageshack.us/img251/7162/aldandnew.jpg
The area in the red rectangle is Stonehouse, the area of my study. From this map we can see that Stonehouse has a much larger crime rate then the surrounding area. looking at stats i have found on the Devon and Cornwall police site i can see that Stonehouse has the largest crime rate in Devon and Cornwall.

Crime rates* in this area for the last 12 months:
*Crime rates is per 1000 people.
From these stats I can see crime rate has risen by 2 per every thousand people since October 2008 and the average number of crimes in this area has increased from 149.7 to 179 which is 19.6% compared to the same three months last year.
The following maps were taken from the Plymouth councils site.
This map shows the roads running through Stonehouse and their hierarchy. From the larger roads (A) which will run from town to town, these will hold the larger and faster flow of traffic. Then the B roads which go connect different parts of the town to the A roads. Followed by the secondary roads which route off connecting different parts of the town together. Then lastly the access roads which are the quieter roads which you will find houses and buisnesses off. These roads have the lower speed limits. The access roads are the most interesting to look at with there irregular gridded structure which looks like it was designed by someone using an Etch-a-sketch.

The image below looks at the footpaths, cyclepaths and parks within stonehouse. These are important because they give is an insight into the leasure aspects of Stonehouse as an area and the possible routes to and from work when not using a car. It is interesting to see the large band of open space at the top edge of stonehouse, this was once part of Stonehouse pool, you can see where the water has shaped the landscape just from this 2d map. It now makes up victoria park a popular area for sports and the local carboot.

Here are the photos which i took when walking through and around stonehouse area. Everything from areas coverd in litter, examples of distruction to property, signs and general images of things which were visually interesting.
Here is a map i made overlaying the mobile phone mast locations aswell as wi-fi hotspots. One image contains the colours used in the maps above showing how the masts are in built up areas rather then less populated areas. the second only displays the road layout, giving a good idea of positioning in comparison with road density.

Subscribe to:
Comments (Atom)
